本文の先頭です。
日刊 温暖化新聞|温暖化FAQ
温暖化の用語
日刊温暖化新聞で取り上げている「人間が化石燃料(石油、石炭、天然ガス)を燃やして、大気中に出している二酸化炭素は、年間72億炭素トン(炭素換算)」という数字の出典は?
世界の温暖化に関する専門家2,000〜3,000人の集まりである「気候変動に関する政府間パネル」(IPCC)が2007年2月に出した最新の報告書です。
気象庁訳の日本語版と、原文の該当ページ(2箇所)は以下の通りです。
「IPCC第4次評価報告書第1作業部会報告書政策決定者向け要約(2007,確定訳)」
(気象庁訳)
■PDFダウンロードはこちら
3ページ:
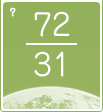
工業化以後における大気中の二酸化炭素濃度上昇の主要な原因は化石燃料の使用であり、土地利用の変化も重要ではあるがその影響は小さい。化石起源の二酸化炭素の年間排出量4は、1990 年代の年当たり炭素換算で64[60〜68]億t5(二酸化炭素換算で235[22.0〜25.0]億t)から、2000〜2005 年には、年当たり炭素換算で72[69〜75]億t(二酸化炭素換算で264[253〜275]億t)に増加した(2004、2005 年のデータは暫定値)。土地利用の変化に関連する、1990 年代の二酸化炭素の平均排出量は、年当たり炭素換算で16[5〜27]億t(二酸化炭素換算で59[18〜99]億t)と推定されるものの、この推定には大きな不確実性を伴う。{7.3}
(原文)
IPCC WG1 SPM
(A report of Working Group I of the Intergovernmental Panel on Climate ChangeSummary for Policymakers)
■PDFダウンロードはこちら
P.2
The primary source of the increased atmospheric concentration of carbon dioxide since the pre-industrial period results from fossil fuel use, with land-use change providing another signifi cant but smaller contribution. Annual fossil carbon dioxide emissions4 increased from an average of 6.4 [6.0 to 6.8]5 GtC (23.5 [22.0 to 25.0] GtCO2) per year in the 1990s to 7.2 [6.9 to 7.5] GtC (26.4 [25.3 to 27.5] GtCO2) per year in 2000?2005 (2004 and 2005 data are interim estimates). Carbon dioxide emissions associated with land-use change are estimated to be 1.6 [0.5 to 2.7] GtC (5.9 [1.8 to 9.9] GtCO2) per year over the 1990s, although these estimates have a large uncertainty. {7.3}
「IPCC 第4 次評価報告書 第1 作業部会報告書概要及びよくある質問と回答」より
(気象庁訳)
■PDFダウンロードはこちら
52〜53ページ
第7章
炭素循環と気候
・ 大気中の二酸化炭素濃度は増加し続けており、現在は工業化時代以前の濃度をほとんど100ppm 上回っている。2000〜2005 年の二酸化炭素の平均年増加率(年当たり4.1±0.1GtC)は、1990 年代(年当たり3.2±0.1GtC)よりもかなり大きい。化石燃料燃焼とセメントの生成による、二酸化炭素の年間排出量は、1990 年代の年当たり平均6.4±0.4GtC から2000〜2005 年の年当たり平均7.2±0.3GtC へと増加した(*1)。
・ 二酸化炭素は大気、海洋、陸上生物圏の間を循環している。それぞれ異なる時間スケールのさまざまな過程を通じて、二酸化炭素は大気中から除去される。二酸化炭素の増加量のうち、約50%は30 年以内に大気から除かれ、さらなる30%が数世紀のうちに除去されるであろう。残りの20%は何千年にもわたって大気中にとどまるかもしれない。
・ 海洋による二酸化炭素吸収の、改善された推定結果によると、1990 年代から21 世紀の最初の5 年間にかけて、海洋の炭素吸収量は年当たり2.2±0.5GtC でほとんど変わっていないことが示唆される。モデル実験によれば、もし大気中の二酸化炭素が増え続けるなら、化石燃料の燃焼とセメント生成により排出される二酸化炭素のうち海洋に吸収される部分は減少するであろう。
・ 大気中の二酸化炭素の増加率にみられる年々〜数十年規模の変動では、気候変動に対する陸上生物圏の応答が支配的要因である。正味の陸上生物圏の炭素吸収量は、1980 年代には年当たり0.3±0.9GtC、1990 年代には年当たり1.0±0.6GtC、2000〜2005 年には年当たり0.9±0.6GtC と推定され、これは、この炭素吸収量に十年規模の変化が観測された証拠である。
(*1)ここや表7.1 や7.2 において示されている不確かさの幅は、現在利用可能な各研究に基づいて、著者らによって可能性が高い(66%)と推定される範囲の評価である。炭素循環のすべての主要な項目に対して、可能性がかなり高い(90%)という評価が可能になるほど十分な研究成果が集まっていない。
(原文)
IPCC WG1 Report
Chapter 7
Couplings Between Changes in the Climate System and Biogeochemistry
■PDFダウンロードはこちら
P.501
Executive Summary
The Carbon Cycle and Climate
* Atmospheric carbon dioxide (CO2) concentration hascontinued to increase and is now almost 100 ppm aboveits pre-industrial level. The annual mean CO2 growthrate was signifi cantly higher for the period from 2000 to2005 (4.1 ± 0.1 GtC yr-1) than it was in the 1990s (3.2 ±0.1 GtC yr-1). Annual emissions of CO2 from fossil fuelburning and cement production increased from a mean of6.4 ± 0.4 GtC yr-1 in the 1990s to 7.2 ± 0.3 GtC yr-1 for2000 to 2005. (*1)
* Carbon dioxide cycles between the atmosphere, oceans andland biosphere. Its removal from the atmosphere involves arange of processes with different time scales. About 50% ofa CO2 increase will be removed from the atmosphere within30 years, and a further 30% will be removed within a fewcenturies. The remaining 20% may stay in the atmospherefor many thousands of years.
* Improved estimates of ocean uptake of CO2 suggest littlechange in the ocean carbon sink of 2.2 ± 0.5 GtC yr-1between the 1990s and the first five years of the 21stcentury. Models indicate that the fraction of fossil fueland cement emissions of CO2 taken up by the ocean willdecline if atmospheric CO2 continues to increase.
* Interannual and inter-decadal variability in the growthrate of atmospheric CO2 is dominated by the responseof the land biosphere to climate variations. Evidenceof decadal changes is observed in the net land carbonsink, with estimates of 0.3 ± 0.9, 1.0 ± 0.6, and 0.9 ±0.6 GtC yr-1 for the 1980s, 1990s and 2000 to 2005 timeperiods, respectively.
(*1) The uncertainty ranges given here and especially in Tables 7.1 and 7. 2 are the authors’ estimates of the likely (66%) range for each term based on their assessment of thecurrently available studies. There are not enough comparable studies to enableestimation of a very likely (90%) range for all the main terms in thecarbon cycle budget.